Historical Performance
A transparent look at our verified past trading results.
Track Record
21 Months
of verified historical data
Historical Return
160%
total return (2024 – 2026) · past only
Strategy
FVG
Fair Value Gap breakout trading
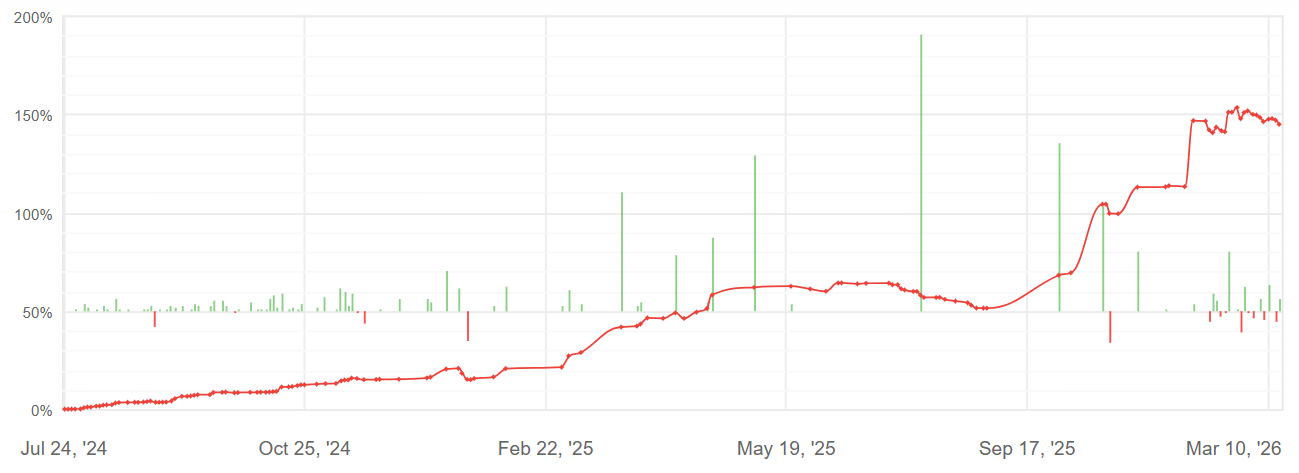
Historical Monthly Returns
Past Data OnlyThe chart below reflects recorded historical performance. Past results do not guarantee future performance.
Understanding Our Trading Strategy
Breakout Trading: Capturing Market Momentum
Our strategy has historically focused on identifying key breakout points where price moved decisively beyond established levels, signaling strong momentum and potential trend continuation.
- Liquidity Zones: We analyse areas where institutional traders have historically accumulated positions, providing context around past breakout points.
- Stop Hunts: Recognising when large players triggered retail stop losses to shake out weak hands before a move — a pattern observed in our historical data.
- Retests: Historically, we monitored price pullbacks to previous resistance or support levels for entry confirmation.
Fair Value Gaps (FVGs): Spotting Market Imbalances
FVGs represent price inefficiencies created by rapid moves. Historically, our system identified these imbalances to anticipate corrections and continuation points. These observations are based on past market conditions and may not repeat.
All strategy descriptions refer to historical methodology and observed past behaviour. Nothing here constitutes financial advice or a promise of future results.
Verified Track Record
21 Months of Real Historical Data
Past performance shown below. This does not indicate future results.
Join the next Sunday Global Sync